Making a Digital Twin Map of My Smart Home
I’ve recently moved to a slightly bigger house, and I replaced most of the lamps with IKEA Trådfri smart lights, installed a couple of remote-controlled sockets, and connected temperature sensors. Since my day job involves creating great-looking maps at Mapbox, I took the opportunity to create a digital twin 3D map of my new house and use it to interact with my smart devices.
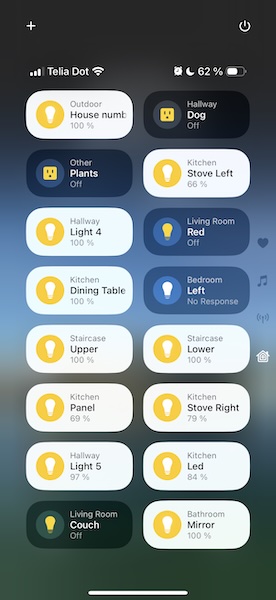
One immediate benefit of this project is the ability to have a quick overview of the state of the house. I use Apple Home to control devices from different vendors, but the more lamps I got, the messier the controls become. For instance, the default control center widget on iOS doesn’t even include all lamps, and their order is usually randomized:
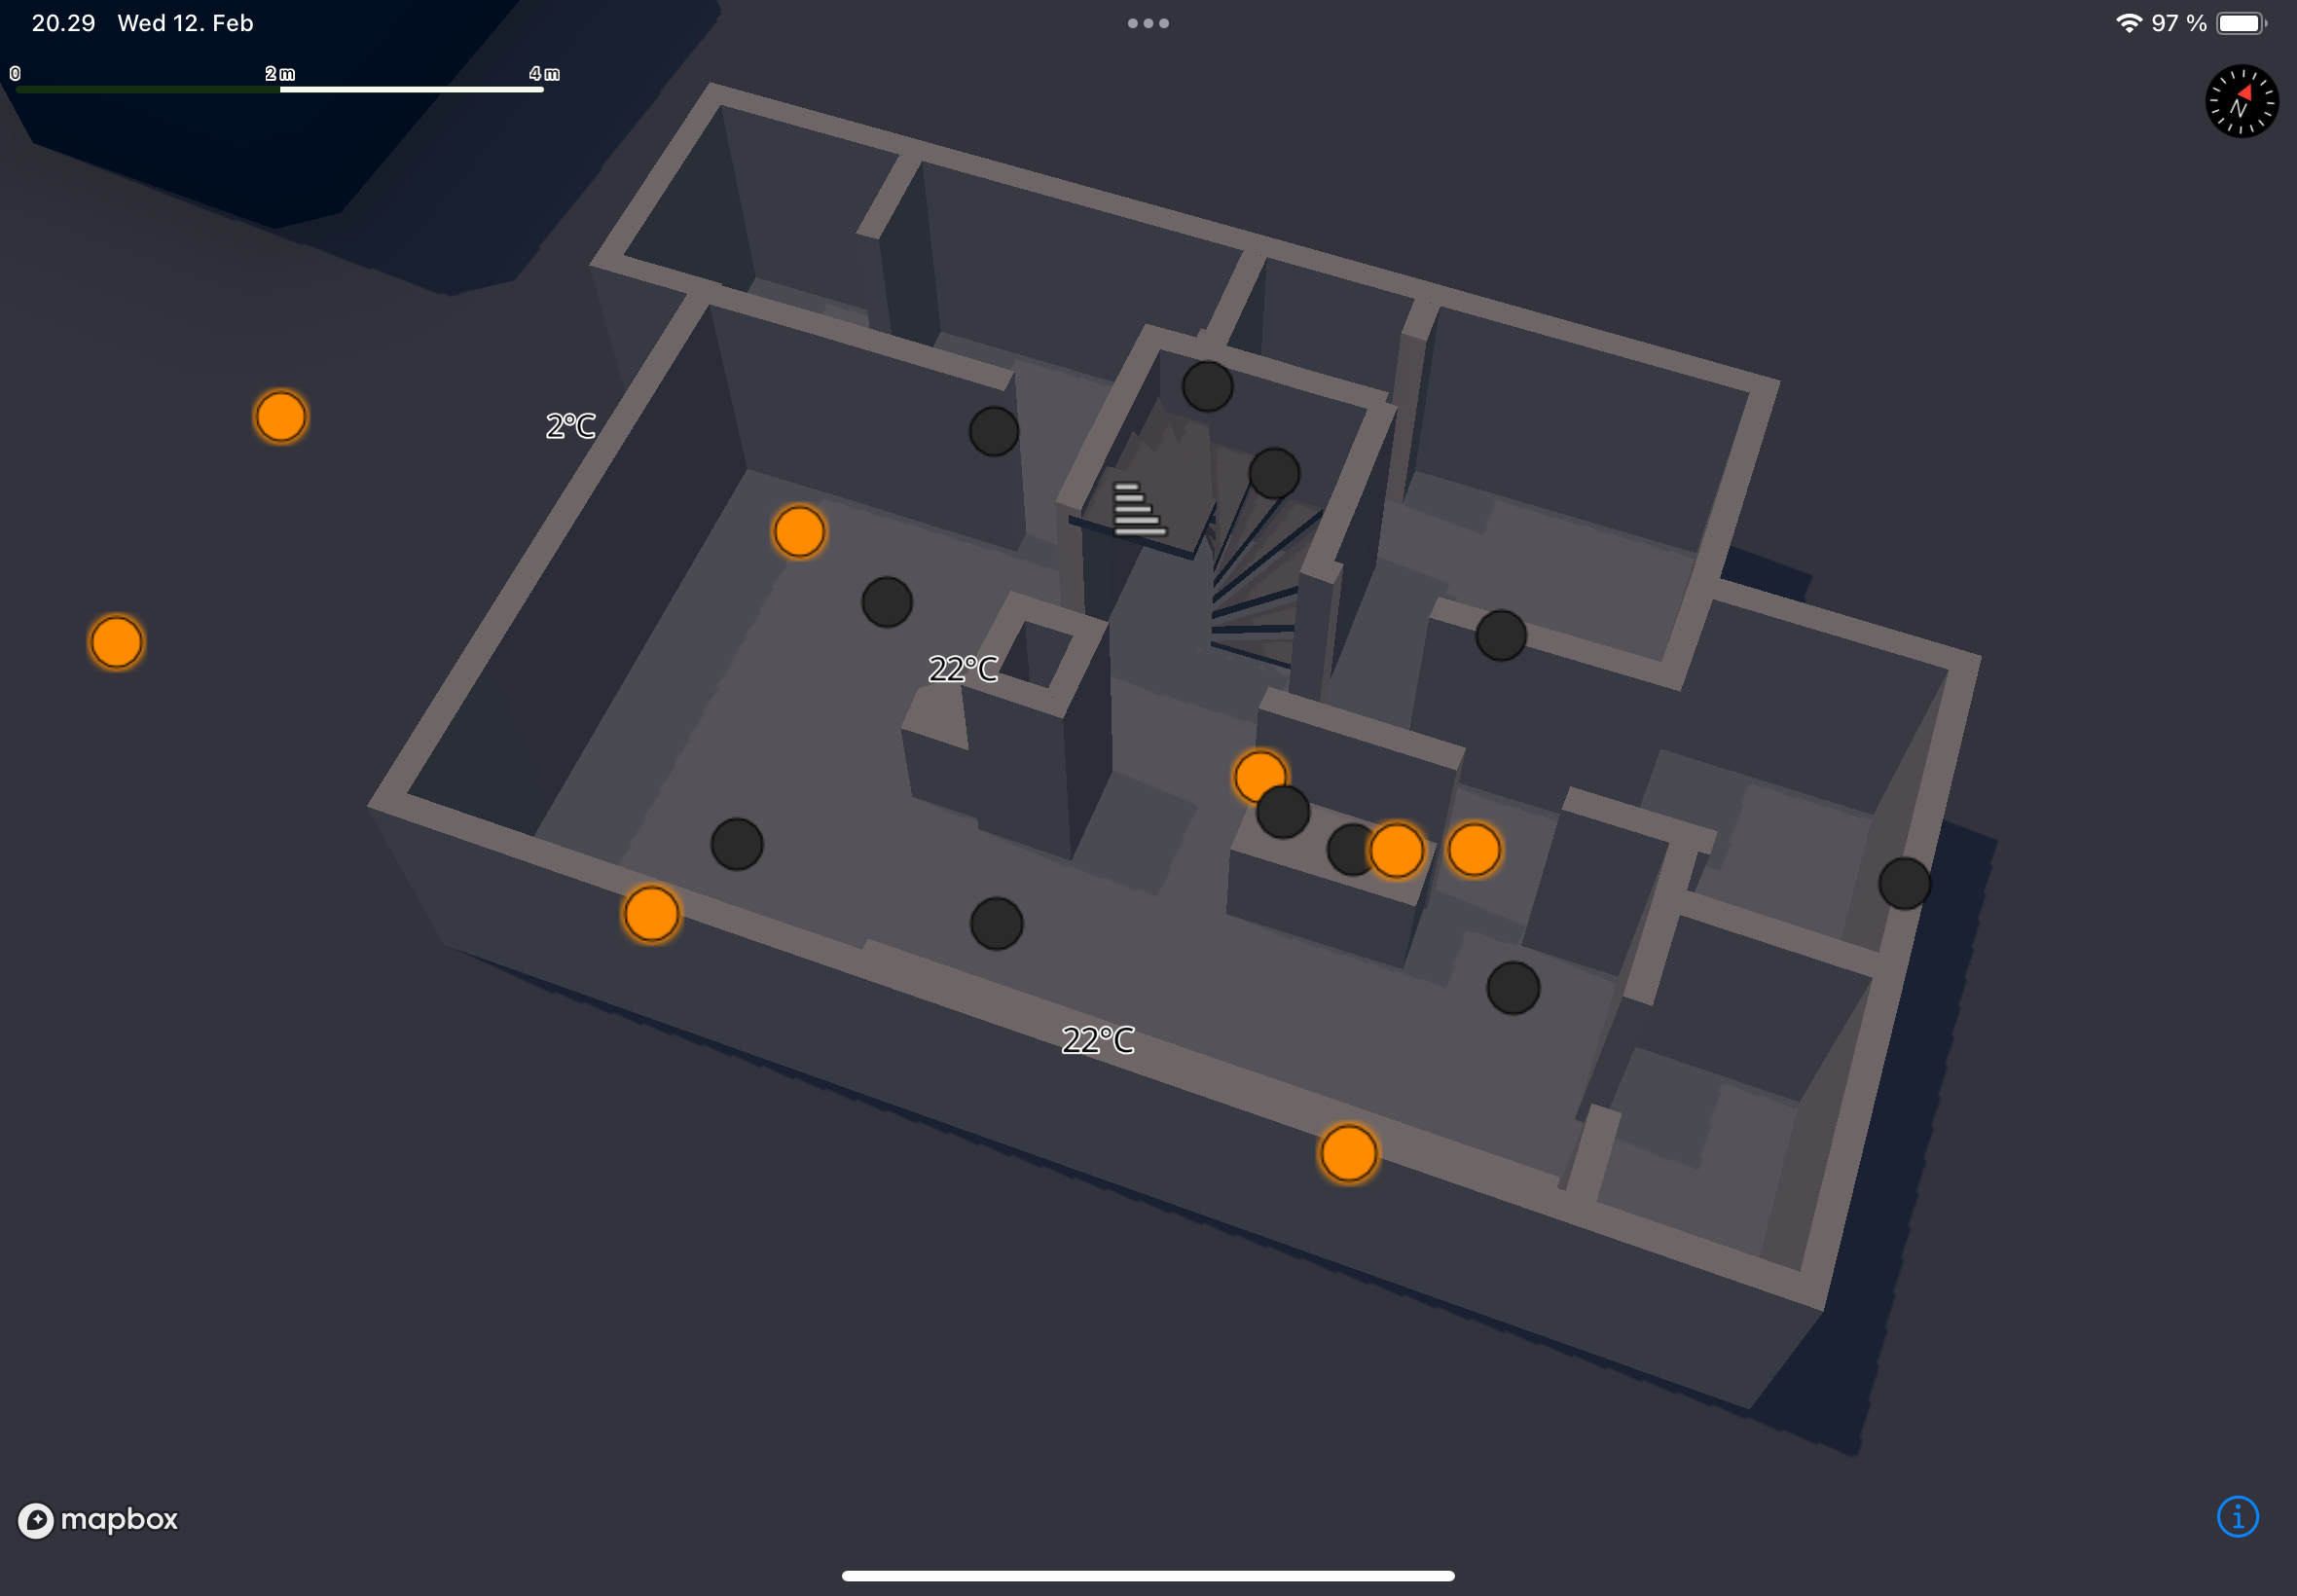
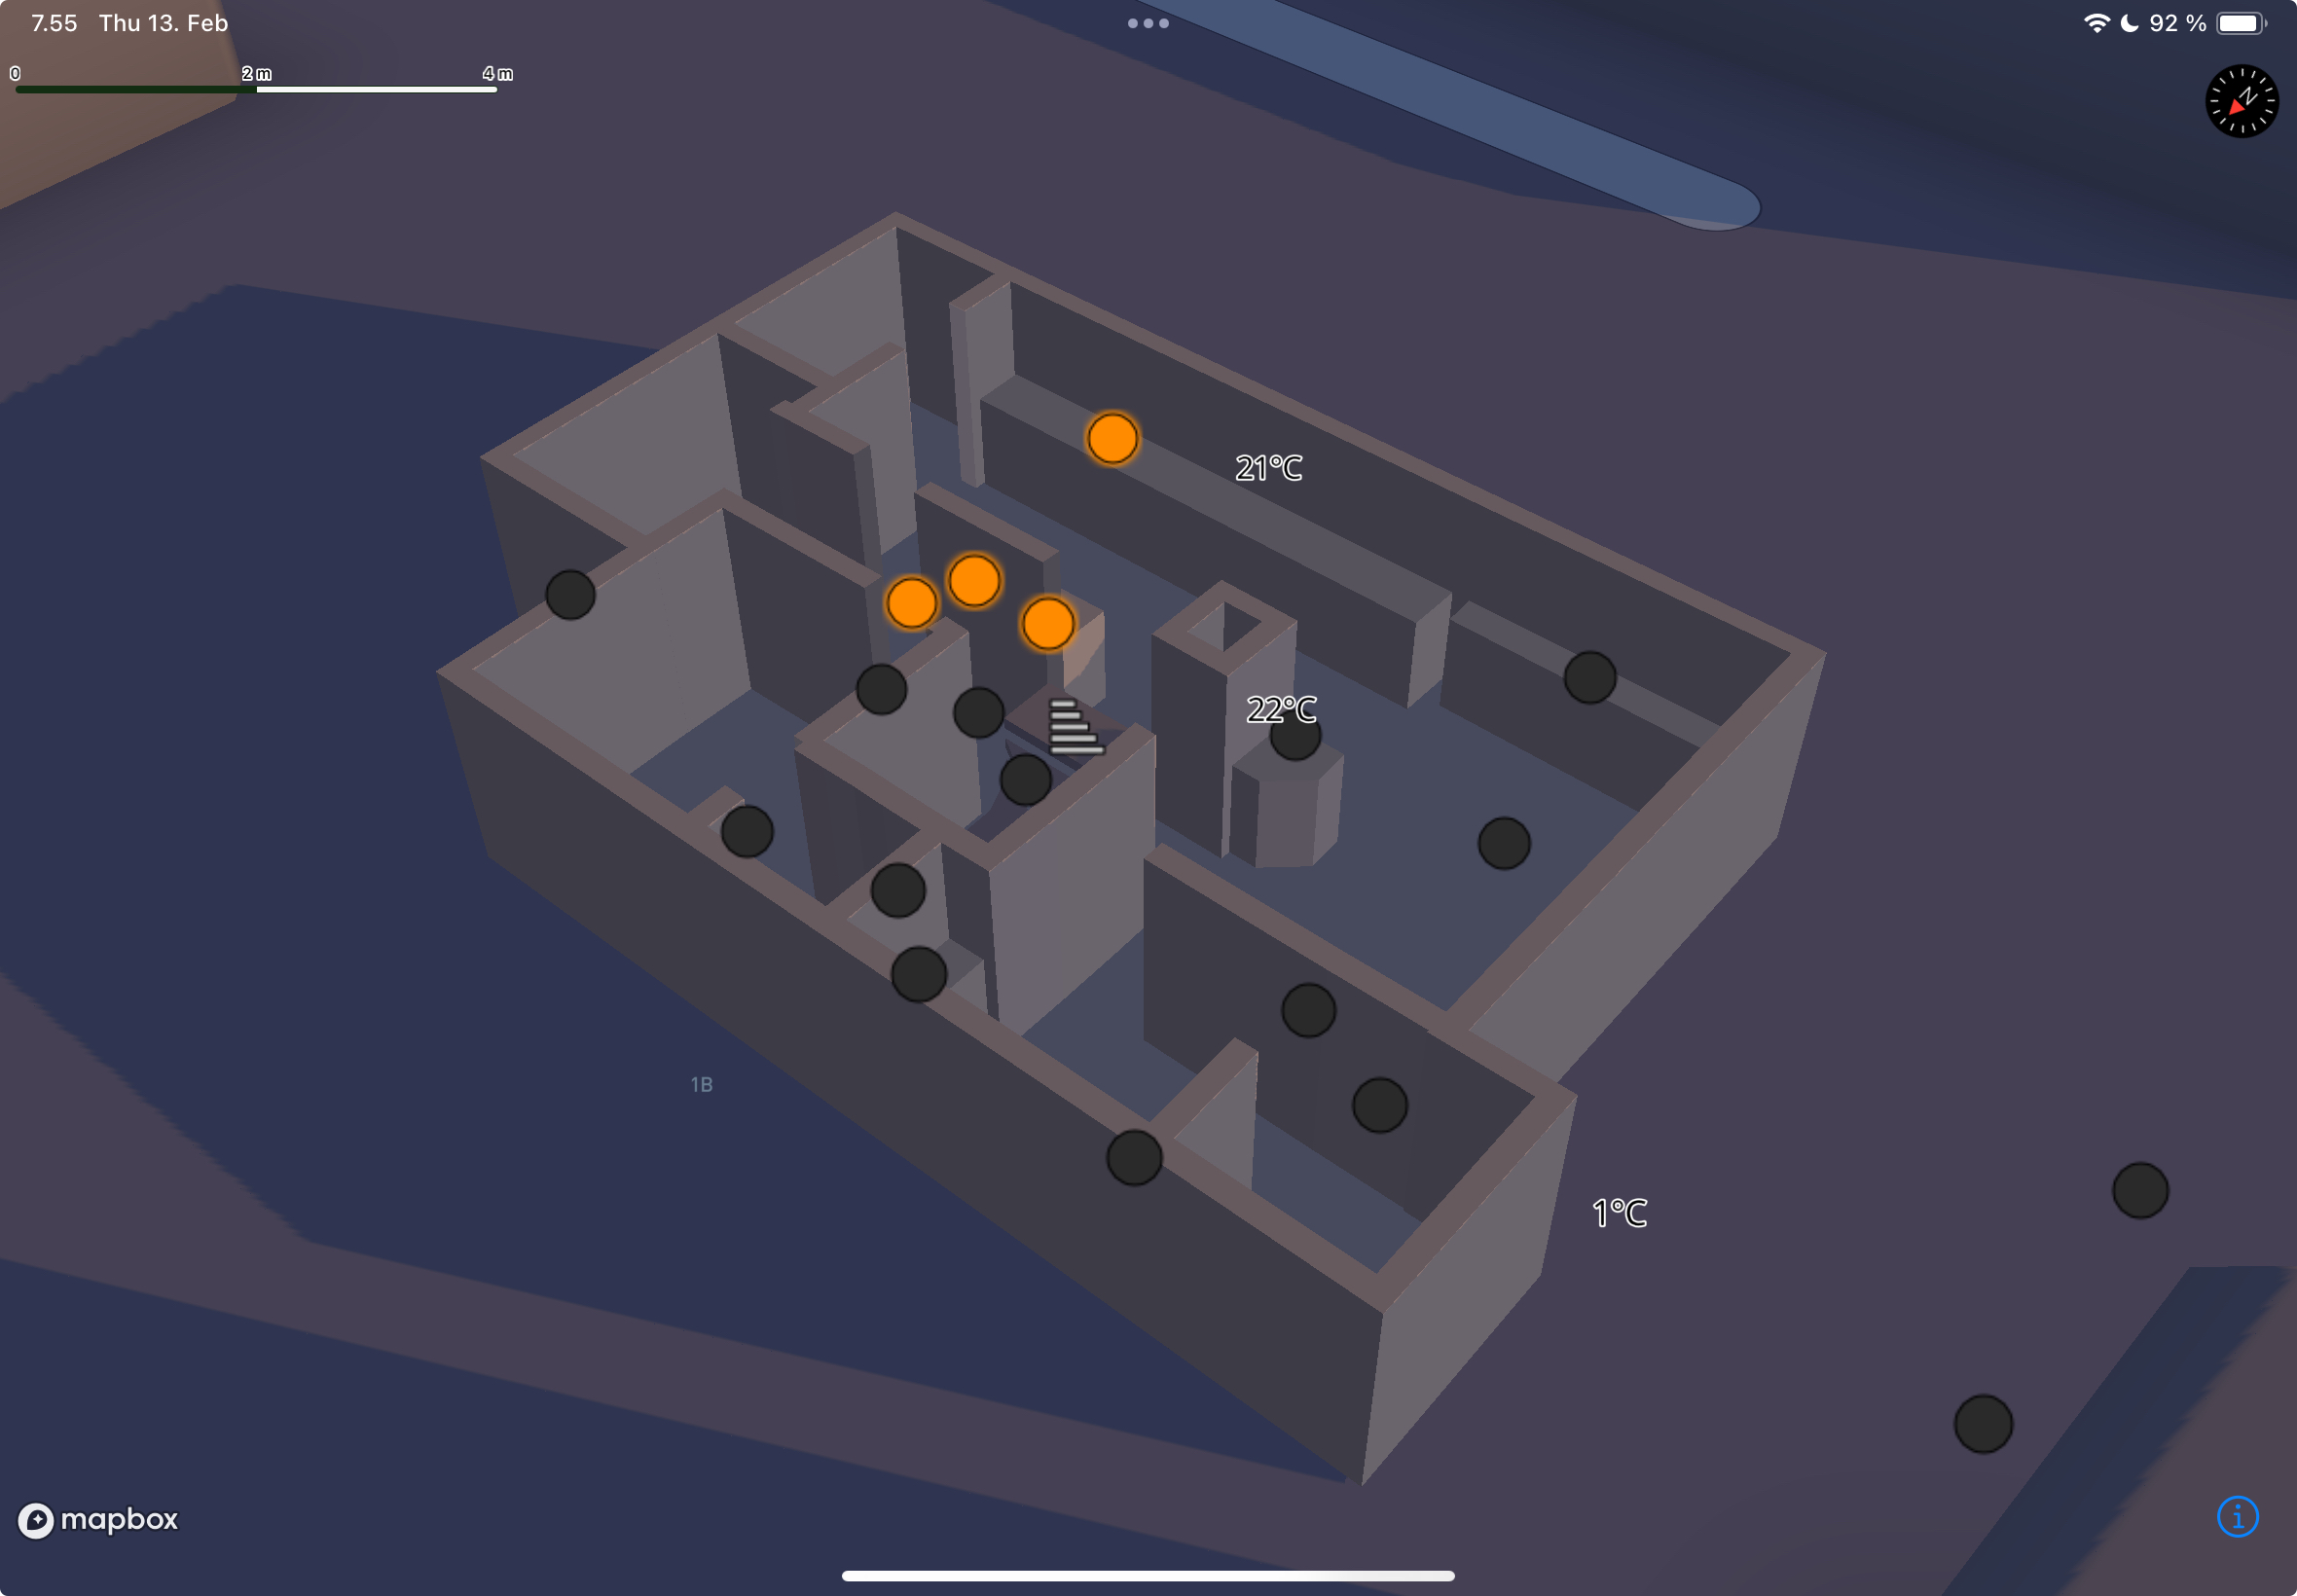
With my 3D indoor map, I can see and control all the devices relative to their real-world locations, which provides a much nicer user experience. Since I also have a couple of motion sensor-controlled lights, I can see those updated in real time, so it feels like a tiny minimalist copy of my house.
Creating a georeferenced indoor map offers benefits beyond just looking cool. For example, in Helsinki there is a real-time API for public transportation arrival times, and my home is near several bus stops. I can use the same map to display the next bus arrivals at their exact locations.
I’ve published the project on GitHub under the name HomeTwin, and it’s easy to customize it. However, it requires a bit of knowledge about creating map data.
Creating an indoor map of my house
For small-scale mapping projects like this, using GeoJSON data sources is an ideal choice. There are tons of tools that can create GeoJSONs, but for indoor mapping use cases it’s also important to load a floorplan image that can be traced in the editor. My go-to map data editor is JOSM, which is free to use and extensible, although it has a somewhat dated GUI and drawing features. To load custom images (including the house’s floorplan), I’ve used the PicLayer plugin.
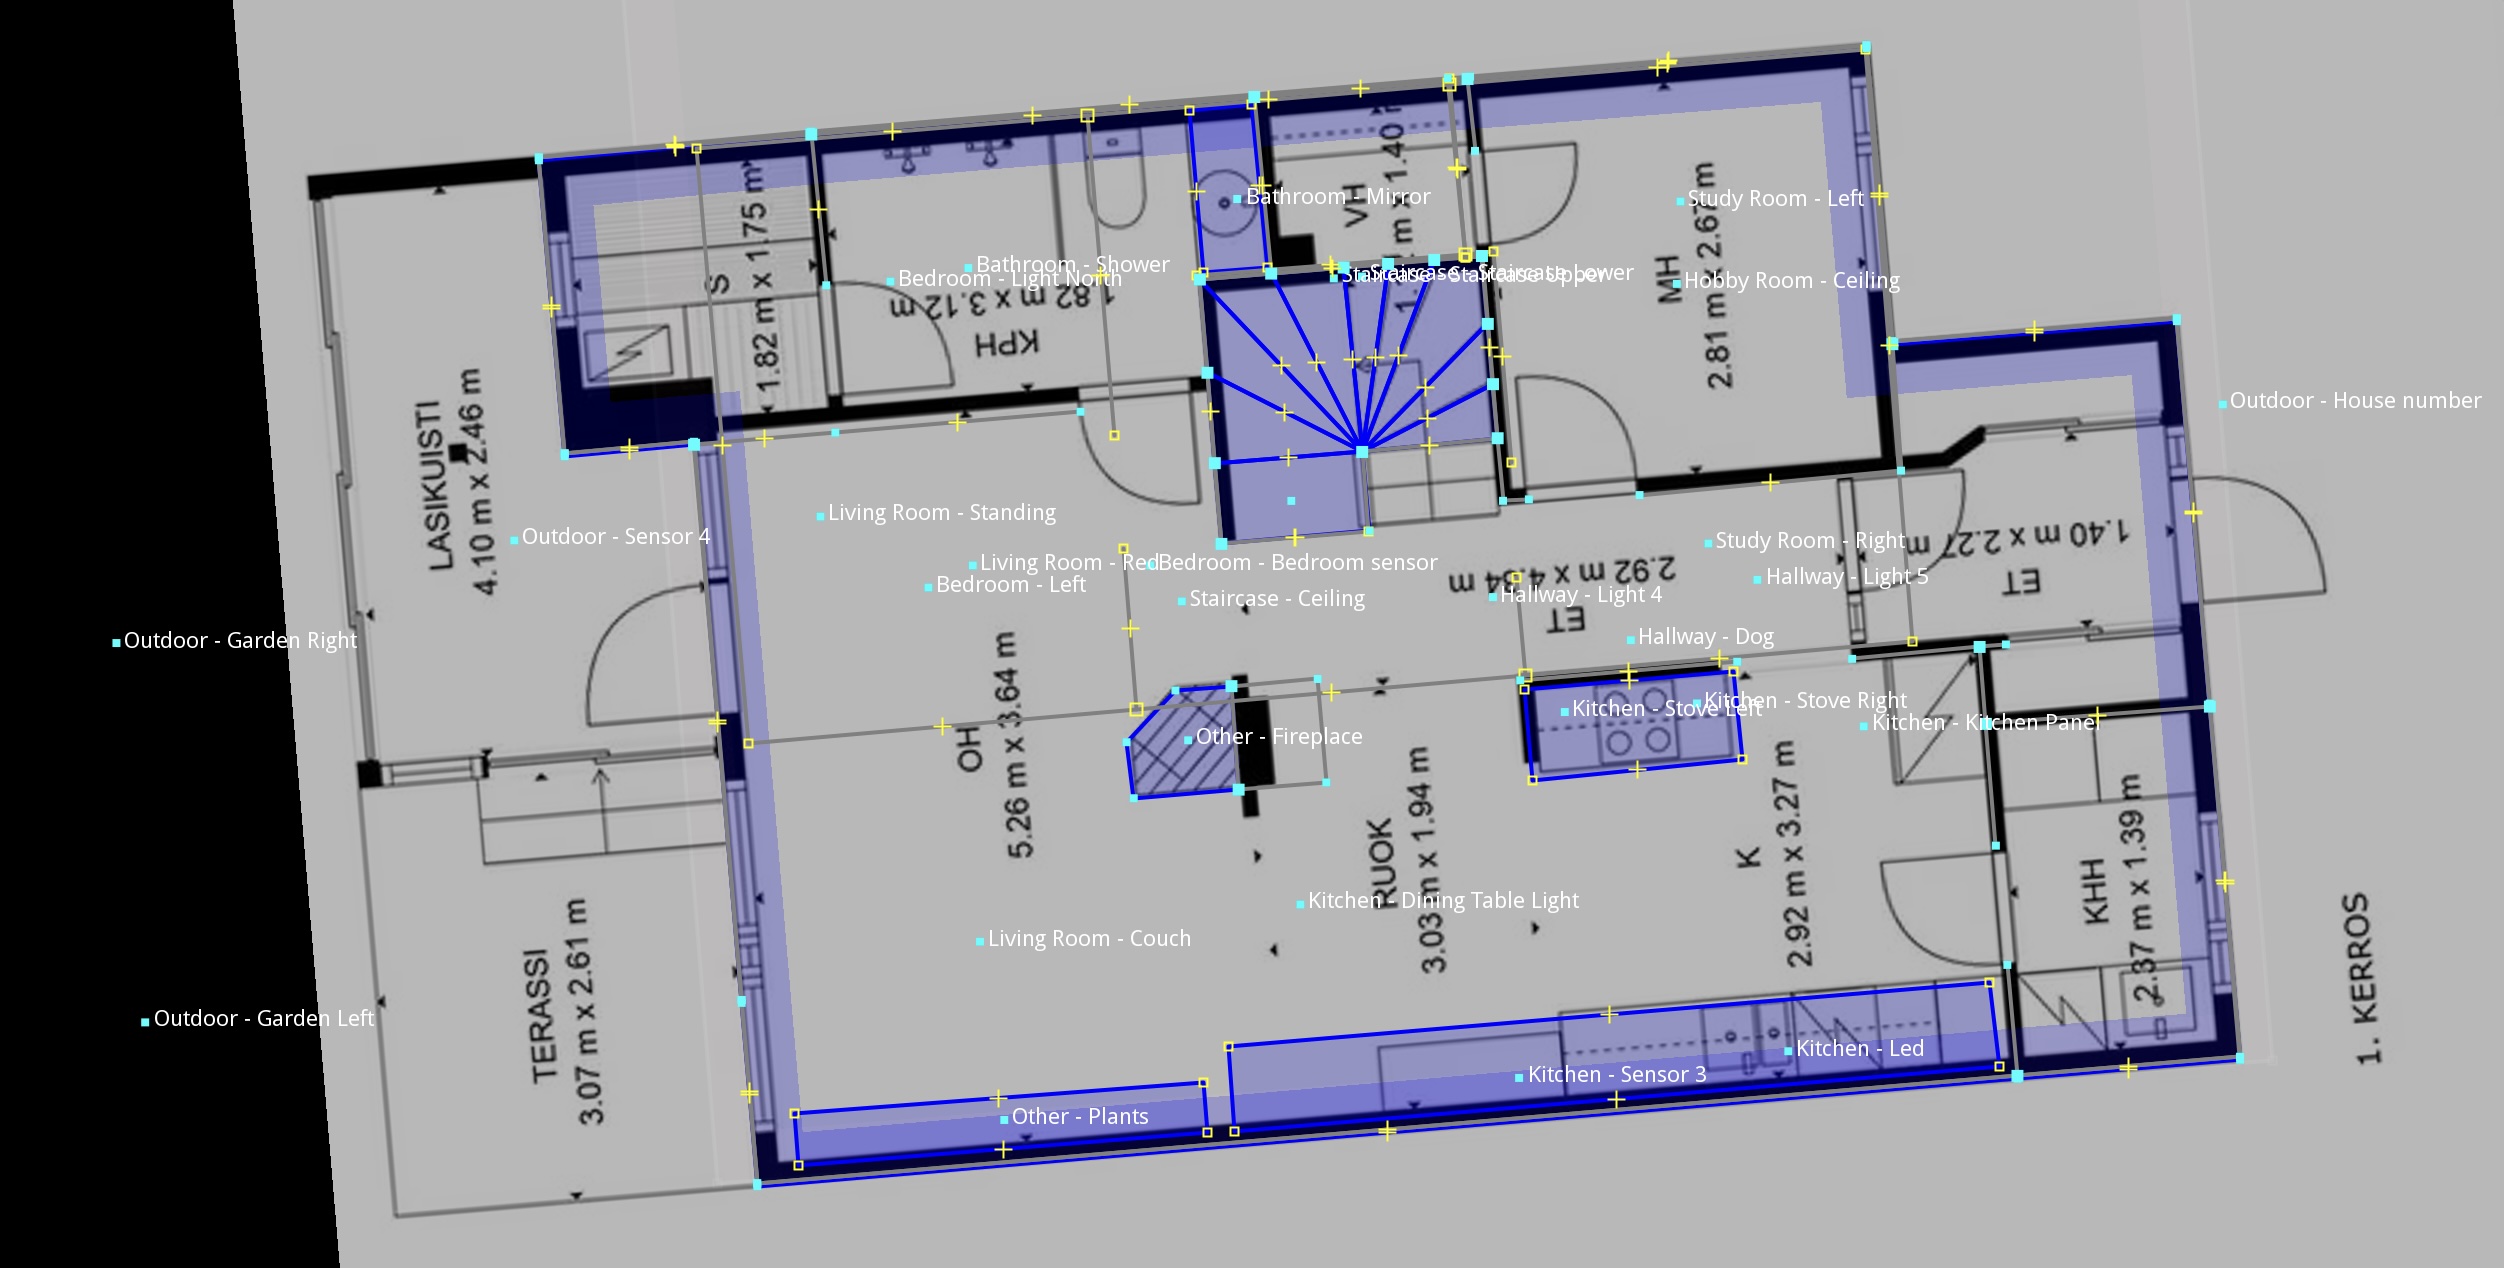
The floorplan image itself doesn’t contain precise measurements, but it’s good enough for the purpose. So the next step was to trace the walls, place points for the lamps and temperature sensors, and label everything accordingly. My labeling is very loosely based on the Simple Indoor Tagging system of OSM, which, for example, includes the “level” key to describe the associated floor of the feature. This is recognized by JOSM and it displays its own level selector automatically, which can be handy when working on multi-floor data.
An interesting quirk of JOSM is that all closed lines are exported as LineStrings by default, and I couldn’t find a button to mark them as polygons. But based on some tips online, labeling features as natural=water turns them into polygons automatically on export, which is fine for the purpose, although I guess there might be another less awkward way of doing this.
In addition to the indoor features, I’ve also added a point with the indoor=staircase label that represents an interactive POI on my map and can be used to toggle between levels.
Using HomeKit
HomeKit is super easy to use on iOS, one of the big benefits of Apple’s walled-garden-like ecosystem. Since I already had all my devices in Apple Home, I just had to add the HomeKit capability to my iOS app, and I could immediately see and interact with them programmatically.
One small surprise with HomeKit in the context of this project was the privacy protection on the accessory IDs. Because they’re uniquely generated per device, I couldn’t use the same ID mapping to the indoor features on my iPhone and iPad. To solve this, people online recommend using the combination of room and accessory names as IDs. The only downside of this workaround is that it requires an update to the map data if the accessory is renamed in the Home application. (Talking about smart home chores.)
Creating a Mapbox style
To connect the floorplan data and the device control logic visually, the only thing left to do is to configure the styling of the map. For this weekend project I made a super simple style which is included in the repository. In this version, the state of the lamps, sensors, and the selected level is injected directly into the source data and read by the properties of the map layers. Last year at Mapbox, our team added support for rendering extruded line geometries and automatically elevating symbols on top of 3D objects, which works great for indoor maps.
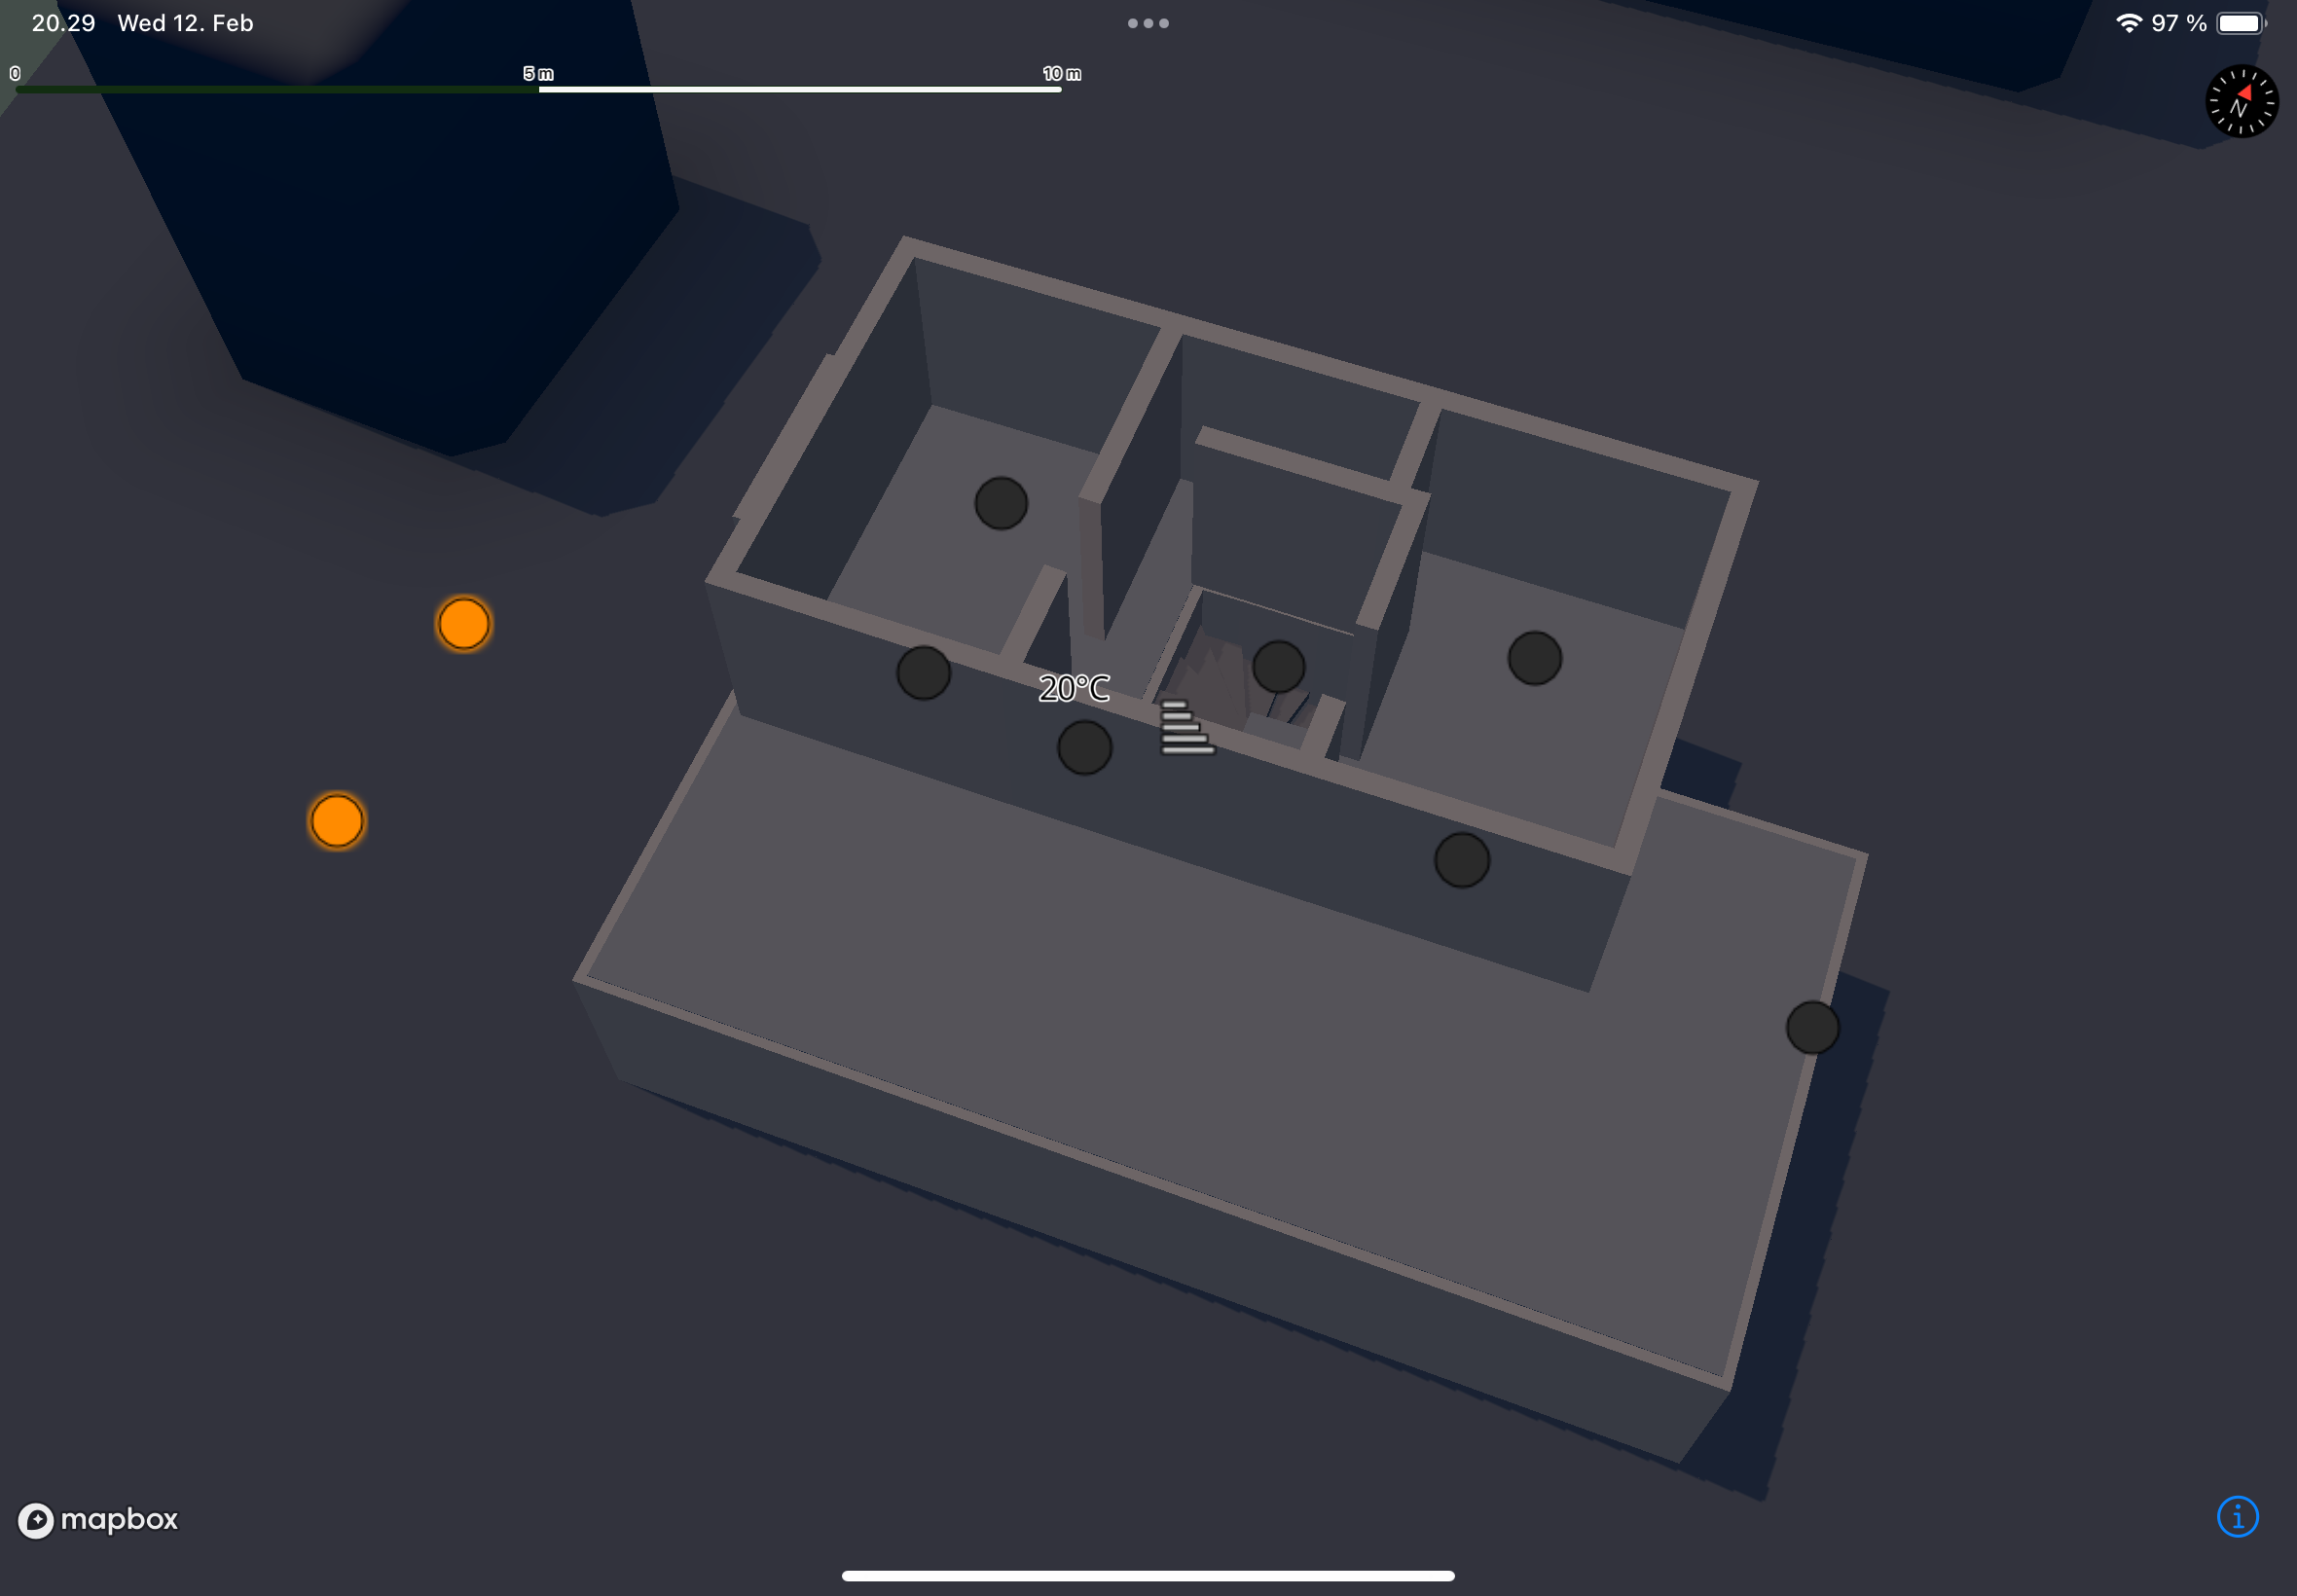
I’ve also used an import for Mapbox Standard which adds the basemap elements and dynamic lights to the map. The time of day can also be configured with the import’s properties, and it can be set to represent the lighting in real time. For example, the same scene looks like this with "lightPreset": "dusk":
The layers in the style read the attributes that were assigned in JOSM. It’s easy to “reverse engineer” it just by reading through, but here’s a brief overview that can help others get started building their own indoor maps. So the attributes I used:
indoor=floorplanrepresents the footprint of the building, which is used in thecliplayer type of the style to hide features from the basemap.indoor=wallrepresents wall features, with their height set based on the associated level values.indoor=lamprepresents a lamp feature (and also power sockets in my case), and it responds to taps in the application to turn them on or off.indoor=objectrepresents generic solid objects which are not as tall as the ceiling, for example my fireplace.indoor=roofrepresents a flat roof which is displayed on the top of the ground floor when the first floor is selected.indoor=stairrepresents the steps of the staircase, with their elevation set by thestair-progressvalues.indoor=staircaserepresents an icon for the whole staircase, which responds to taps to select between the floors.indoor=temperature_sensorrepresents temperature sensors and displays their current readings in Celsius.
And mainly that’s all! Writing this blog post and overview took longer than setting up this project, but it just shows how easy it is to plug things together. There’s also a bunch of other features that could be added to it, for example to control the color temperature of the bulbs or to display smart speakers and other properties of the house. The project itself can be a nice starting point for creating similar smart home visualizations.
Finally, here’s HomeTwin in action:
And the repository’s link again: https://github.com/endanke/HomeTwin